
Is voting a right or a privilege? Honestly, I think it’s best viewed as a responsibility. As American citizens, it’s our duty to make our voices heard in local, state, and federal elections.
Every four years, candidates race to the finish line for the White House. There is a sense of excitement but a buzz of uncertainty, too. Will this election be different? Are all states truly represented?
Historically, certain groups like young people, minorities, and low-income individuals tend to have lower voter turnout. A recent study looked at voter distribution across all 50 states, focusing on key factors like race, age, gender, income, and education. The states where the voting population mirrors the overall electorate are more likely to elect representatives who genuinely reflect and support the needs of everyone.
Want to know which states have the best—and worst—representation come Election Day? Let’s take a look!
Best: New Jersey

This year, around 6.7 million voters in New Jersey—about 71% of the state’s population—are gearing up to vote. You might also hear that most voters are focused on financial issues. A solid 40% of people are worried about the economy, taxes (especially property taxes), and the overall cost of living. But are New Jerseyans truly represented?
It turns out they are! The Garden State ranks number one in racial representation, second in age, and fourth in gender. With a score of 96.6 out of 100, the state’s electorate reflects its population well.
Best: New York

Over the past 20 years, New York has made great progress in electing more diverse representatives from previously underrepresented groups. It’s now just behind New Jersey in overall election representation.
New York ranks fourth in the nation for age representation. The state also performed well in racial representation, placing 13th, and in gender representation, ranking 21st. These factors combined gave New York an overall score of 94.1 out of 100. It’s a big step forward for diversity in the Empire State!
Best: Maryland

This election is shaping up to be historic, and it’s great that Maryland is set to have the third-best representation on Election Day with a score of 93.8. Maryland leads in age representation, scoring an impressive 97.23% match with the overall electorate, and ranks 10th for racial representation.
However, the study showed that the state ranks third worst for gender representation. There’s still work to do, but Maryland is on the right track to making its voice heard this election!
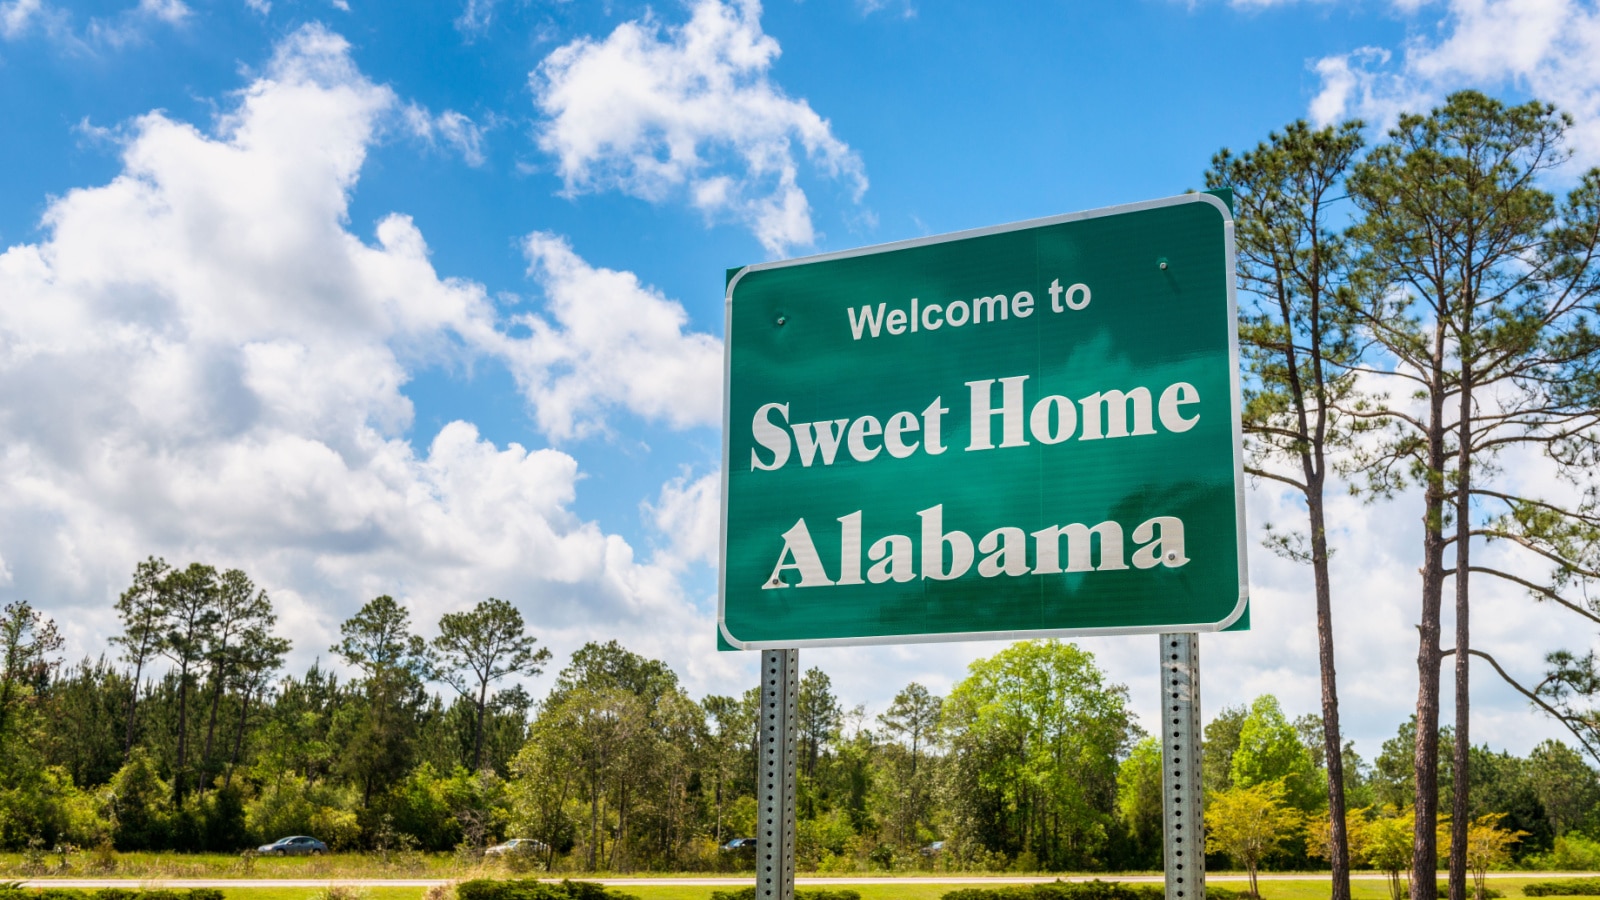
Best: Alabama
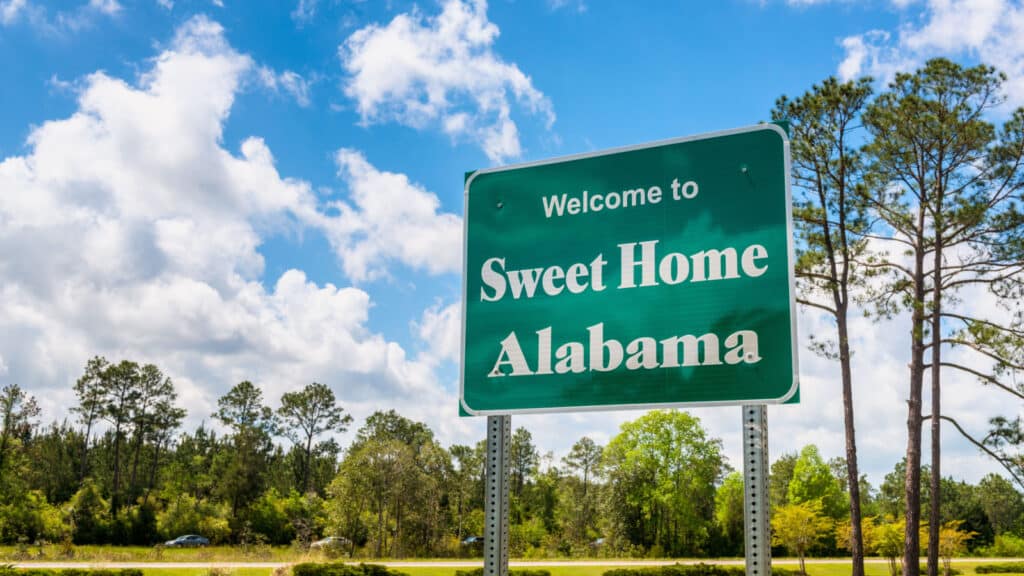
Alabama recently redrew district lines to more accurately represent the African American vote, and a recent study confirms it ranks fifth in racial representation and fourth overall for Election Day.
In recent years, Alabama has worked to improve access to polling places and voting resources, making it easier for residents to vote. In 2020, only 62% of voters participated—one of the lowest turnouts in 30 years. However, that number has steadily increased from about 2.8 million a decade ago to around 3.3 million by the end of 2022. This year, we can expect even more active participation!
Best: California

It’s hard to imagine that a decade ago, California had a record-low turnout of 7.5 million voters. But this year, around 22 million registered voters (82% of eligible adults) will receive a vote-by-mail ballot.
The Golden State has secured fifth place for the best representation on Election Day. While both major parties are becoming more diverse, likely voters still skew older, wealthier, and more college-educated. Many young, nonwhite, and lower-income residents are still unregistered or infrequent voters, so here’s to hoping for more progress in getting everyone involved!
Best: Rhode Island

The Ocean State is dedicated to ensuring each voter has access to the ballot box. This year is especially significant as it marks the first presidential election since the 2022 Let Rhode Island Vote Act, which expands access to mail-in ballots. The state aims to boost voting participation and accessibility, building on the past year’s high turnout.
Voting is essential for our democracy, and Rhode Island hopes for the residents’ civic participation. It’s great to see the state ranking third in racial representation—every voice matters!
Worst: Oklahoma
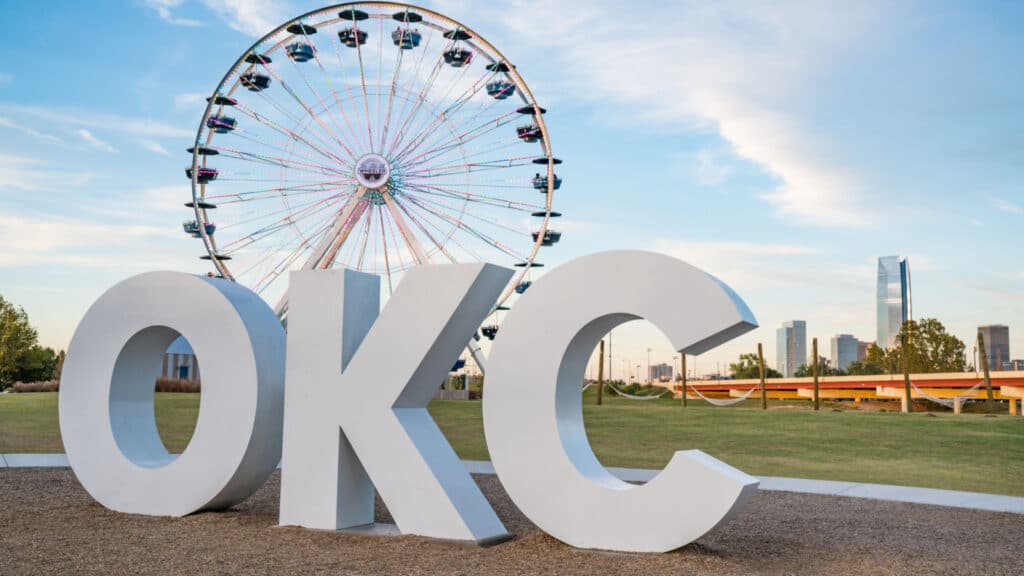
In states like Oklahoma, gaps in certain demographics can skew election outcomes, favoring those who vote while leaving others behind. Right now, Oklahoma faces significant challenges, ranking worst in age and gender representation and overall election representation.
The state’s voting system has contributed to low turnout rates and the rise of more extreme candidates, disenfranchising many voters, especially those excluded from primary elections. It’s time for the Sooner State to prioritize civic engagement programs that educate and inspire citizens to get involved in the electoral process.
Worst: Massachusetts

The racial turnout gap—the difference in voting rates between white and nonwhite voters—is a critical measure of participation equality. A recent study shows Massachusetts ranks 49th out of 50 states for overall representation on Election Day and is dead last for racial representation.
According to a report, neighborhoods with more people of color have lower voter turnout. In wealthy, predominantly white towns, around 90% of voters cast ballots in 2020, while turnout in less affluent, diverse cities dropped to just 55%. Some areas still struggle with access to polling places and voting resources, leading to significant disparities in participation.
Worst: North Dakota

Did you know North Dakota is the only state without formal voter registration? Unfortunately, it’s not much better for North Dakota when it comes to representation—it ranks second worst for racial representation and third overall for Election Day representation, just ahead of Massachusetts.
The primary election in North Dakota saw a disappointing voter turnout of only 20.1%. Secretary of State Mike Howe noted that negative political ads might have discouraged some middle-ground voters from participating.
Worst: West Virginia
West Virginia has one of the lowest voter turnout rates in the country, and many are wondering if this election will change that. A recent study shows the state ranks fourth worst overall for Election Day representation and fifth worst for racial representation.
Over the years, West Virginia’s low labor force participation has pushed many young workers to leave, leading to the biggest population loss percentage in the U.S. This has left some young voters feeling pessimistic about the future. Still, as election day nears, organizations are stepping up to motivate young voters to make their voices heard!
Worst: Vermont
Vermont’s primary election recently saw the lowest turnout in years, with just 15% of voters participating. That’s a drop from 34% in 2020 and 23% in 2018. Many accessibility challenges still impact voters with disabilities, a diverse group with various needs.
Ironically, Vermont has some of the lowest voting barriers in the nation. Whether you’ve never registered before or recently moved and didn’t get your mail-in ballot, same-day voter registration lets anyone register and vote on the same day.
Worst: New Hampshire

New Hampshire usually sees high voter turnout, but there are major gaps in participation among different demographic groups, impacting fair representation. In the last election, only 24% of the state’s 18-year-olds voted, although 83% of registered young voters made it to the polls.
Same-day voter registration gives younger voters a chance to participate, but it doesn’t fully offset the challenges posed by voter suppression laws that make it harder for them to vote. Let’s not forget that New Hampshire ranks third worst for racial representation, so there’s still work to do to ensure everyone’s voice is heard.
Source: WalletHub
10 of the Best U.S. States To Live In (2024), According to a New Study

Recently, a study dug into the nitty-gritty of all 50 states, looking at housing costs, income growth, hospital quality, education rates, average hours worked per week, and commute times. After crunching all those numbers, the results are in for the ten best states to live in.
Read more: 10 of the Best U.S. States To Live In (2024), According to a New Study
12 of the Best and Worst Places To Retire in the U.S., According to a New Study

In the U.S., some benchmarks make some areas better or worse for retirees than others. A recent study took a deep dive, ranking over 180 cities based on affordability, quality of life, healthcare, and fun activities. These are some of the best and worst cities to consider for your sunset years.
Read more: 12 of the Best and Worst Places To Retire in the U.S., According to a New Study
12 of the Most Fun States in America, According to a New Study

No matter where you are in the U.S., Americans really know how to have a good time. We’ve got epic national parks, endless coastlines, Super Bowl Sundays, and 4th of July fireworks. I’ll take you through America’s most fun states based on real data, taking into account the number of restaurants, amusement parks, and music festivals. Is your state on this list?
Read more: 12 of the Most Fun States in America, According to a New Study